Freeform gradient
The Freeform gradient tool group under the Gradient tool contains several tools that create a gradient between two drawn lines, based on the colors of those lines.
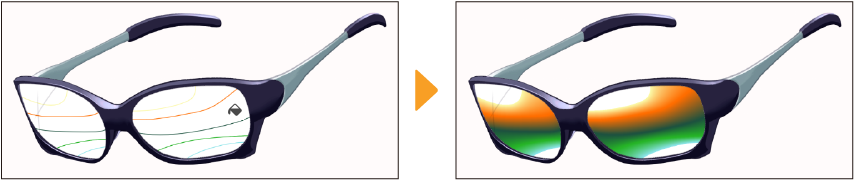
The tool can be further refined using the Tool Settings palette and the Advanced tool settings palette. The settings allow you to set a reference type, exclude a color, and adjust gradient tones.
Memo | ·The Freeform gradient tool will not fill properly if the lines were drawn with anti-aliasing. When creating the reference lines, make sure the drawing tool’s Anti-aliasing setting is turned to Off or None. ·Freeform gradient is not available in Clip Studio Paint DEBUT. |
In the Tool Settings palette, you can configure the processing method for black and transparency and output of the created gradient.
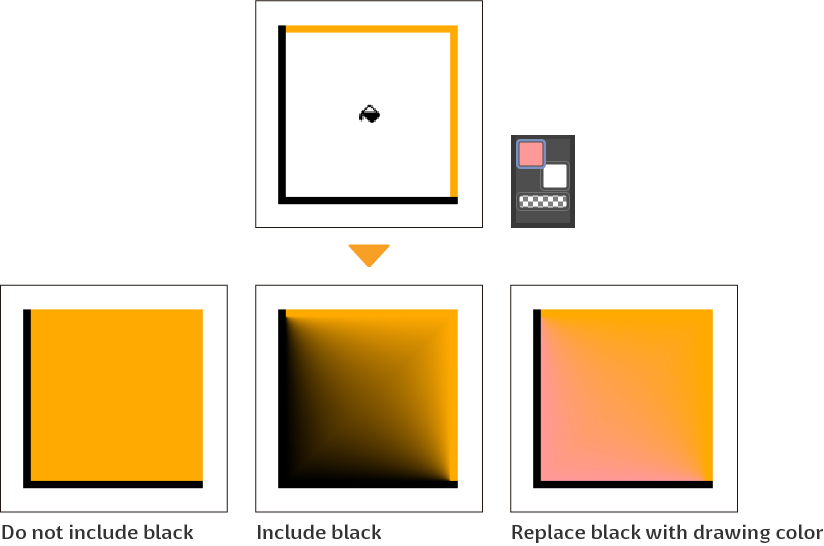
Black
Sets how to process black lines drawn in the layer for painting.
Do not include black: Black lines are recognized as the boundary, but are not recognized as a color.
Include black: Black is treated as a drawing color. The gradient will include black.
Replace black with drawing color: Black lines are recognized as the boundary, but are replaced with the selected drawing color in the created gradient. The color forms a gradient closer to the drawing color the closer it gets to the black line.
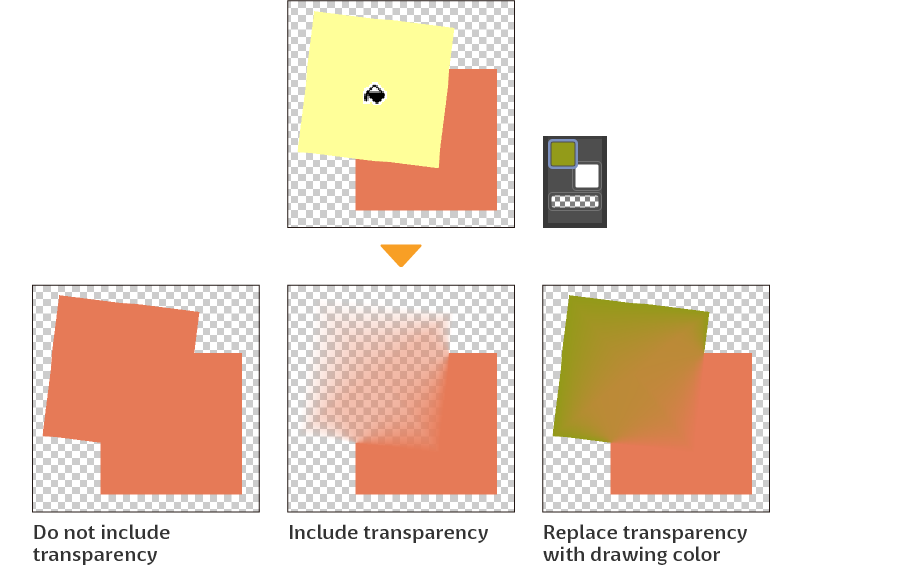
Transparent color
You can set how to treat the transparent area when using Freeform Gradient on an area filled with a single color. When referring to multiple layers, if nothing is drawn on the layer where the Freeform Gradient is applied, that area will be treated as transparency.
Do not include transparency: Transparency is recognized as the boundary, but not recognized as a color.
Include transparency: Transparency is treated as a drawing color. The gradient will include transparency.
Replace transparency with drawing color: Transparency is treated as a boundary line and replaced with the current drawing color. The drawing color becomes stronger the closer the gradient gets to the transparent area.
Output Settings
Tap the button on the far right to open the Output Settings popup, where you can set how the density of the gradient changes.
To adjust the graph, tap on the graph to add points. You can adjust the curve of the graph by dragging the points. You can drag a point out of the graph to delete it. The results of the adjustment are shown in the preview below the graph.